I play a game called Dominions. Dominions is an incredibly deep 4x turn based strategy game that takes place in a fantasy setting with a very large variety of magic spells, rituals and units.
In Dominions you take are a powerful being that rules a nation and aspires to godhood. The player creates an avatar, known as a Pretender God, to represent them in the world. The type of Pretender God you can create varies from magically powerful arch mages to dragons, huge titans or large immobile monuments. When you start the game you decide what kind of god you are and how your Dominion affects your lands, followers and sacred soldiers. In order to win a game of Dominions, you must either eliminate all players, or capture a certain amount of thrones which are scattered around the map. Thrones are defended by powerful AI armies so you must be careful when seizing them.
There are currently 3 ways to play Dominions.
- You can play on a map which was hand-designed by somebody. These maps have the start positions for players and thrones placed manually by hand and typically have some sort of artwork made by hand. Maps like these can be uploaded to the Steam workshop. Since these maps are not randomly generated, you can memorize their layout. Some players might not have fair starting positions. There are a lot of variables that can make or break a handcrafted map.
- You can use the game’s built-in random map generator. Many people detest this tool because it has a tendency to not place the thrones fairly on the map. Ideally, all players should start off equidistant from each-other. Thrones should also be fairly distributed in a truly balanced game of Dominions.
- You can use Cartographic Revision, a closed-source third party map generator. This tool is much better than the default map generator. It places thrones fairly and it produces good looking maps. The logic it uses when determining province distribution and player start locations seems more robust.
Why make your own map generator?
Though I really like Cartographic Revision (it’s what inspired me to make this tool), it does have some downsides:
- The user has no control over the generated map. You can’t edit manually alter anything once you’ve generated a map, what you see is what you get. This is a problem with the built-in Dominions map generator as well.
- Certain player counts are unsupported. Do you have 11 players? You’re going to have to make a 12 player map and leave one of the player starts empty. This means a few players are going to have a vacant lot as a neighbor, which means they get some free real estate.
- Cap rings are too random. A cap ring is the provinces adjacent to a player’s main starting castle. Castles draw resources from adjacent provinces. If you start with only 3 connected provinces, your income and available resources will be worse than that of another player who has 5 provinces in their cap ring. In Dominions the game balance is already dubious at best. Some nations are considered much stronger than others. Some nations are outright banned from games for being too powerful. My goal was to make every nation have 5 provinces in their cap ring so that no player ends up stuck with a bad starting position.
- No roads. A road is a connection between provinces which reduces the movement cost between them, allowing armies to move further in a single turn. For reasons unknown to me, Cartographic Revision does not have these.
- Certain combined province types, such as cave forests or reefs, don’t exist in Cartographic Revision. I planned to expose all available province modifiers in my map generator and allow the random generation to use them.
- A memory leak causes Cartographic Revision to crash after you regenerate the map 3 or 4 times. Not the end of the world but slightly annoying at times.
Of all these reasons, the first is the highest value. Being able to manually tweak a generated map is extremely useful.
I had other goals in mind once I started planning my own map generator:
- Make the map generator open ended so other people could add their own art styles to it. The ideal situation would be that the user chooses the art style from a dropdown menu. In the end I only partially accomplished this goal. There were enough bugs to fix and features to tweak in the original map generator art style that I never had time to focus on non-essential features.
- Make provinces have distinct visual cues. One thing i dislike is not being able to tell what attributes a province has at first glance. If a wasteland province has the warmer province attribute, then logically there should be cacti growing on it. If a plains province has the large province attribute, then it should have buildings scattered around which let the player know that it has a higher population than the average province.
- Expose more options to the user. If the user wants to cluster water nations together to create one gigantic ocean, they should have the choice. Ideally i also wanted to expose everything to the user – what percentage of the provinces on the map will be forest, how often rivers and mountain passes are placed, and so-on.
From start to finish
Though Cartographic Revision is closed source, you could de-compile it to read the logic behind it. I personally don’t like doing this because it’s disrespecting the wishes of the creator and both of our map generators take a different approach to creating maps anyhow. Thus I made the conscious decision to not peek under the hood.
I documented everything from start to finish, partly for motivation and partly because I have a habit of keeping tabs on how things progress and what my thought process is at the time.
The very first functional map generator version was incredibly basic. Just a collection of nodes with player starts pseudo-randomly inserted. This obviously would not do. It was evident from first glance that player starts need to be static in order to be fair.

Next, I generated connections between nodes. Since the map has to wrap horizontally and vertically, there needs to be edge connections that wrap the far ends of the map together. I did not show these visually (yet) but they were programmed.

Next, nation data and world generation needed to be fleshed out. I hard-coded the types of provinces in the cap rings of each nation and added some logic for the sprinkling of different province types across all the nodes. Connection generation was also worked on. Rivers and cliffs are sprinkled between nodes to create interesting bottlenecks.

Next, support for some other player counts was added to test the speed of the map generation. For a 20 player map it only took about 0.3 seconds to finish.

At this point i was pretty confident that implementing manual province and connection editing was doable. All that was needed was a simple UI that allows the player to tweak the province flags and connection flags. The user clicks a node and the UI pops up.

With simple province and connection editing finished, it was time to start introducing some randomness into the location of each province. The pink border represents the final dimensions of the map.

Next, I focused on making sure that the map would wrap properly along the seams. With 4 copies of the map tiled you can see there was one issue at the corner connection, but otherwise everything looked good.

With wrapping complete, it was time to start producing the actual provinces. My goal was to use simple meshes for all 2d polygon shapes.

The simple polygons don’t look very appealing, so next I worked on adding some randomness to the polygons, and improving the edge cases.

This looked better, but it still wasn’t good enough. Introducing random noise to a line between point A and point B will just give you a squiggly line. I wanted something more organic, so I started using bezier curves.

These shapes were definitely more interesting, though still too simple. The bezier curves needed more knots to make them more interesting.

These shapes were better, but not perfect. I finished the province wrap logic and started work on river and road polygons. It became immediately clear that complex bezier curves with a lot of knots from point A to point B resulted in the best organic looking shapes.

Roads did not need to be as complex, as long as they connected province A to province B.

One thing that was really important to me was visually obvious borders between provinces. I used line renderers to highlight polygon edges.

Next, I worked on making some shaders for the province polygons to make them look more like terrain. Using a perlin noise shader, it was easy to make my provinces look similar to the ones generated by Cartographic Revision.

With province shaders finished, i started work on sprite placement. This was the most costly process in terms of processing power required. In order to properly find all valid sprite positions inside of a province polygon, i do hundreds of ray-traces downward onto the polygon. If the ray hits, it’s added to a list of valid sprite positions. Doing this across the entire map takes time but I was pleased with the end result. I took a mental note that this process could likely be optimized in the future.
With my approach, I am placing meshes and sprites in front of a static camera which then renders what it sees to a RenderTexture. This texture can then be read and output as the final product. I also display this texture off to the side next to the meshes and sprites, so the user can see the interactive nodes, and also look at the map as it would appear without them.

In order to organize sprites properly and make it easy to tweak, I exposed everything to the Unity editor UI. There are plenty of options for each sprite which help determine its color, chances of being placed, space taken, and terrain which it can be considered valid for.

Connections between provinces also need to place sprites in some cases. A mountain pass has specific rules to create a dip in the middle to show the players that it can be traversed. I also introduced more jitter to the province polygons to give them a more organic shape.

At this point my main concern was creating sprites for all different terrain types.

Each sprite requires a summer and winter version, since the seasons do change in Dominions. Provinces also require a different colored shader for winter.

Once all the basic artwork was complete, the next step was writing the output logic. All map information such as province connections and terrain information is stored as plaintext in a .MAP file. The coordinates of pixels that belong to a given province are also stored in this file. Testing this output meant you had to output the map, then open it in the built-in Dominions map editor to visually inspect it.

Finally, I had to figure out fair layouts for the oddball playercounts. For 16 players it is trivial to organize the player starts into a 4×4 grid. Each player gets 4×4 provinces to themselves, which means 15 normal provinces and 1 throne.
How do you do this with 17 players? I had to start playing around with grids in MSPaint to solve this. Green squares are player starts, blue squares are potential provinces that would be in their cap ring, and purple squares are thrones. Some liberties had to be taken, for example, the center player may possibly have a slight advantage in terms of available real estate and nearby thrones. I tried to balance this by giving other players thrones that are closer to their cap ring.
Once I was happy with the grid layout, I could use the grid as a reference to figure out the coordinates of player starts and throne positions.

And that was it! With support for all player counts, I could output maps of any size.

The gritty details
I kind of glossed over some of the more technical stuff, so I’ll try and explain some of the more complex aspects of this tool in detail.
Province polygons
In order to create a group of provinces that connect without gaps, I had to figure out the shared borders between provinces.
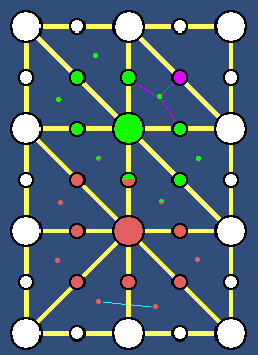
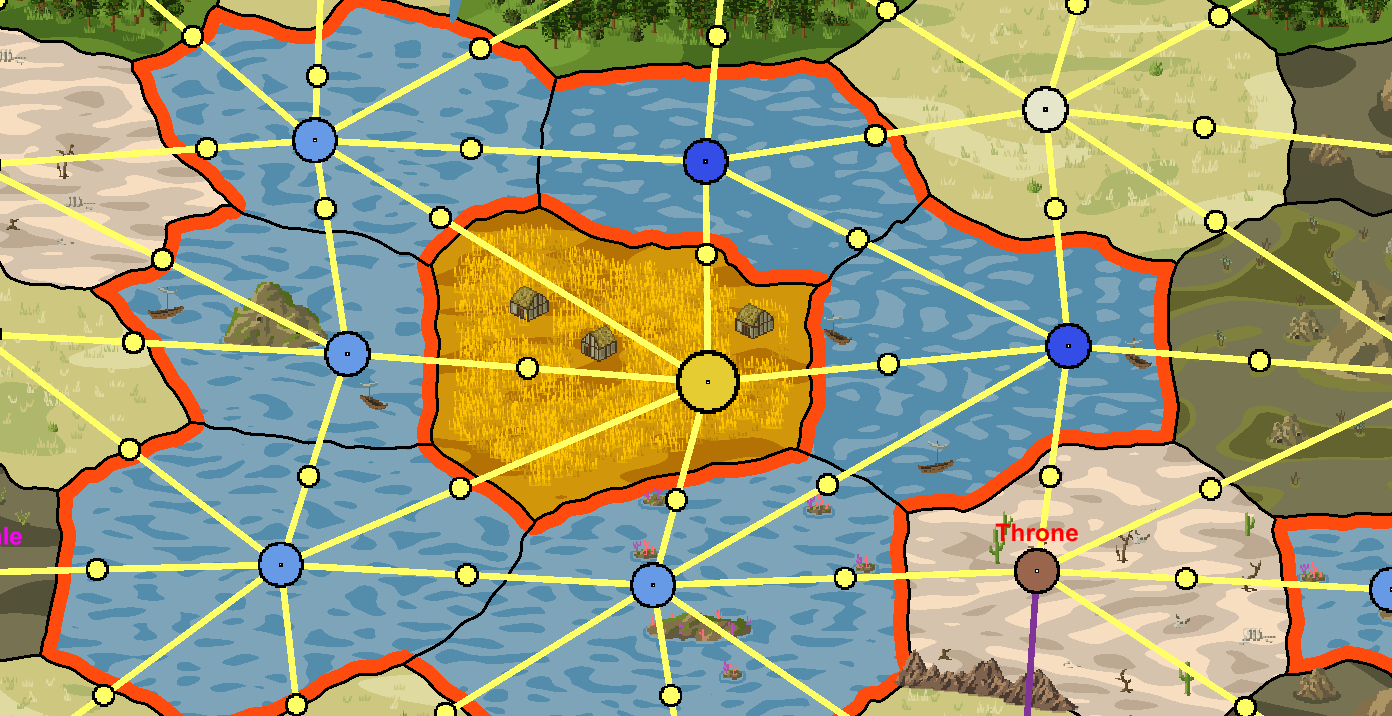
In this example, let’s focus on the 2 large colored province nodes. A province border can’t just use each connection center (the second smallest dots) as a corner. The borders are determined by taking all the connections that form triangles and computing the triangle center. The pink lines show this in action. The pink connection dot and its neighboring green connection dots form a triangle, so I compute their center point. This point belongs to all 3 of those connections. If this logic is repeated across the entire set of connections, each connection will have 2 neighboring triangle center points that are relevant to it. If you traverse through the connections belonging to a province node and connect their triangle center points, you form a polygon. Repeat this logic for all province nodes and you have a collection of province polygons perfectly connected without gaps.
Since in this case the grid of nodes are equidistant, the resulting polygon will be a predictable shape. I make several tweaks to get a more interesting result:
- Deform the grid a little bit by applying random jitter to the province positions (being careful not to overdo it).
- Make the polygon borders more interesting by using bezier curves.
- Adjust the connections based on the traits of their nodes. For example, if the green province had a small province flag assigned, then it would pull the center of its associated connections towards it slightly, resulting in a smaller polygon.
Sprite placement
There is a specific order in which things are generated when a new map is created.
- Generate the conceptual information (a simple grid of conceptual nodes and connections) and assign terrain data.
- Place the actual unity objects in the scene and assign the conceptual data to these objects, taking care to keep the conceptual and unity object logic separate.
- Compute the meshes to be used by each province and connection.
- Compute valid sprite placement positions for each mesh.
- Place all sprites.
- Assign sorting order to sprites (so sprites render in the proper order).
![]()
This farmland province is on the bottom left of the map, so parts of its mesh fall outside of the map border. I ignore the outer portions of the mesh since they won’t appear on the final outputted image.
In order to determine positions where sprites can be placed, I compute the bounding box of the mesh and trace hundreds of rays within that bounding box. I resize the bounding box if it falls outside of the red border to avoid unneeded raycasts. If the ray collides with the mesh, it’s a valid position. If the ray collides with a different mesh, it’s an invalid position.
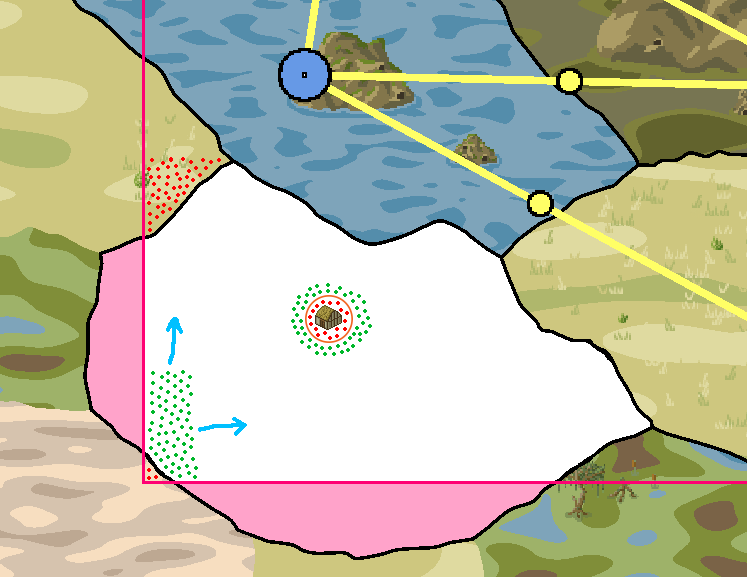
I apply a small amount of jitter to the start position of the ray so that the sprites don’t appear to be placed uniformly. Green dots are valid points and red dots are invalid.
Once the set of green points is determined, I start placing sprites. When a sprite is placed, it deletes all other potential sprite placement points within a certain radius of itself. In the diagram, a farm house would clear out all the nearby positions so that the wheat doesn’t get placed too close to it. Each province type has different settings. Farmland places wheat sprites very densely, so it uses almost all of the computed sprite positions. Other provinces such as wastelands don’t need to place a lot of sprites, so they require less positions.
Province textures
I use a very simple set of perlin noise shaders to give the provinces their texture.
There are a few parameters i have control over in each material:
- X/Y randomization seed (this is mostly unused since most of the shaders use different scaling anyhow)
- X/Y scale. This determines how squashed the blobs are. With an X scale of 1.0 and a Y scale of 0.3, the blobs become vertically squashed to give the feeling of perspective. With an X and Y scale of 0.01, the blobs become very small and the texture looks grainy, almost like the white noise you’d see on a tv screen.
- Colors. There can be anywhere from 2 to 5 different colors used.
- Thresholds. Each pixel computed by the shader has a perlin noise value that ranges from 0 to 1. The thresholds determine what range of values will belong to a certain color. In the plains province shader, values from 0 to 0.35 result in off-white, values from 0.35 to 0.75 result in pale yellow, and values from 0.75 to 1 result in green. These thresholds can be tweaked to increase or decrease the size of the off-white and green blobs.
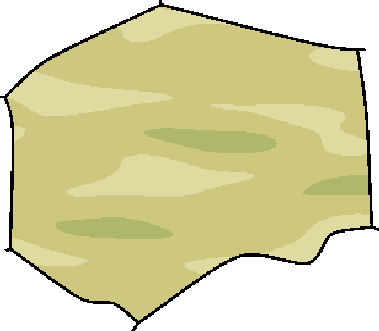
That’s all there is to it. Each province type has a texture for summer and winter, and typically the only thing that differs between these textures is the color palette used.
Shorelines
My water shaders alone didn’t look very convincing so i used line renderers to add shorelines to the rivers and seas. In order to make it look good without overlapping onto land with the line renderers, i used modified versions of the perlin noise shader that makes use of stencil buffers. The logic is simple, any edge line that borders a body of water will create one line renderer for the black edge line, and one line renderer for the shoreline. Unity line renderers use 2d meshes to draw the line, so materials and shaders can be assigned to them.
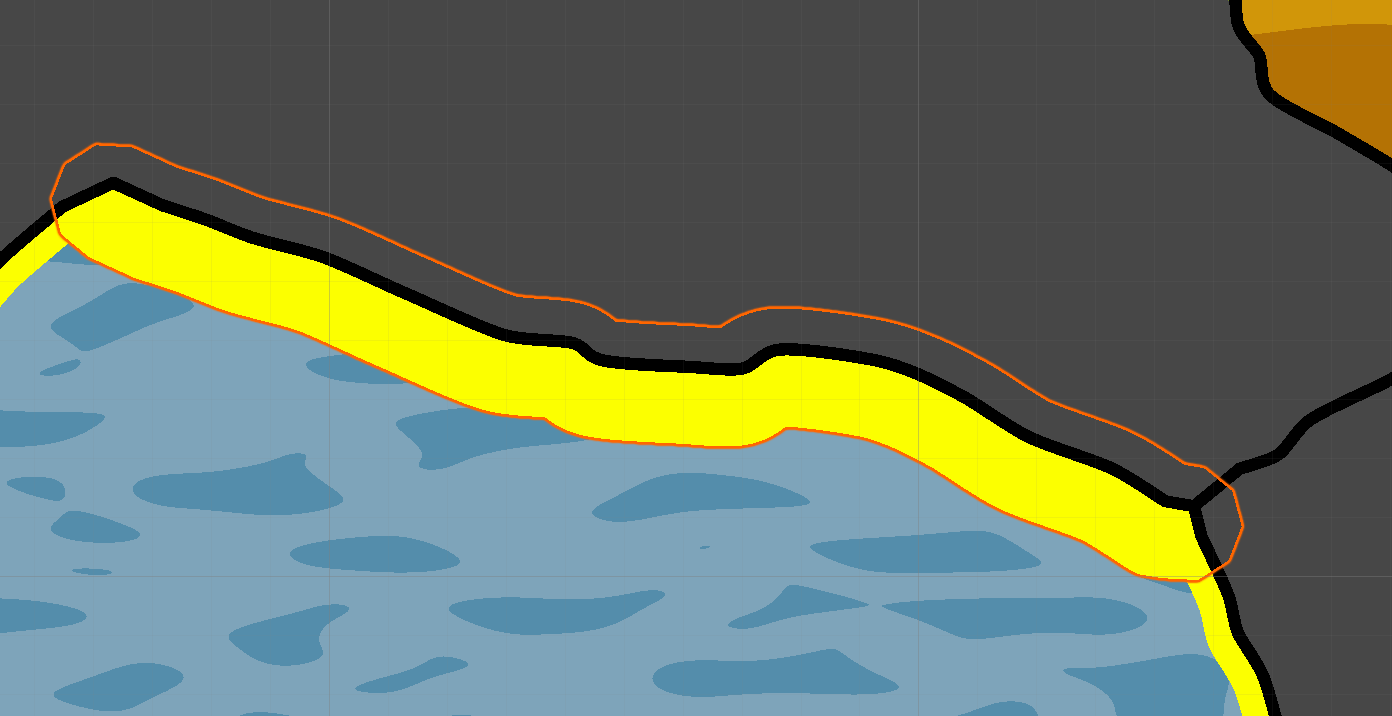
Once i had the stencil buffers working, i could put the shorelines on every connection that touches a water province.
And with shorelines working properly, the water shaders could be tweaked to look a bit more realistic. I also used these shorelines on the river meshes since they looked so good.
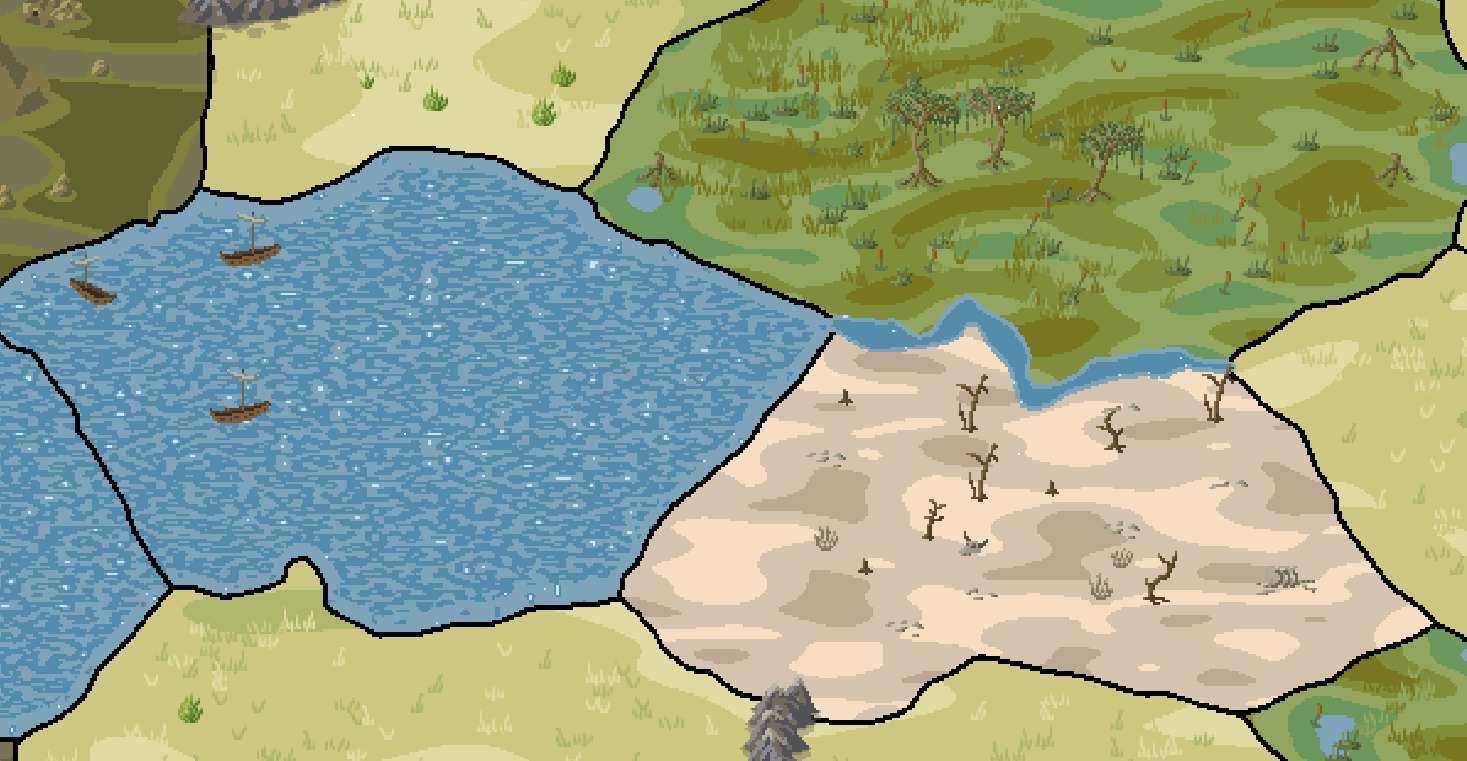
And there you have it, low-effort shorelines.
What’s next?
I’m keeping track of my to-do list on the github page for this project. It’s mostly been whittled down to the non-essential features at this point.
I made the choice to make this open-source because I believe that the sprite art could be revised by someone more artistically inclined. There’s certainly a lot of ways that the world generation could be optimized as well. In the long run this tool can only benefit from more pairs of eyes looking through the code and finding ways to improve it.
You can download this tool for free on itch.io.